The RED method: A new strategy for monitoring microservices
Monitoring an application is crucial for providing a quality product and experience for users. But simply collecting a ton of application metrics doesn’t solve the true problem. What software companies need is a way to get actionable insights from their metrics so they can quickly fix any issues their users are experiencing.
Enter the RED method.
RED method origins
The RED method is a monitoring methodology coined by Tom Wilkie based on what he learned while working at Google. RED is derived from some best practices established at Google known as the “Four Golden Signals,” developed by Google’s SRE team.
The primary rationale behind RED is that previous monitoring philosophies and methodologies such as the USE method didn’t fully align with the objectives of software companies and modern software architectures. USE applies more to hardware and infrastructure, while the RED method intends to focus on what users of an application are actually experiencing.
The goal of the RED method is to ensure that the software application functions properly for the end-users above all else. In the modern era of microservice architectures, containers, and cloud infrastructure, metrics related to hardware aren’t nearly as important as long as your service level objectives (SLOs) are being met.
RED method explained
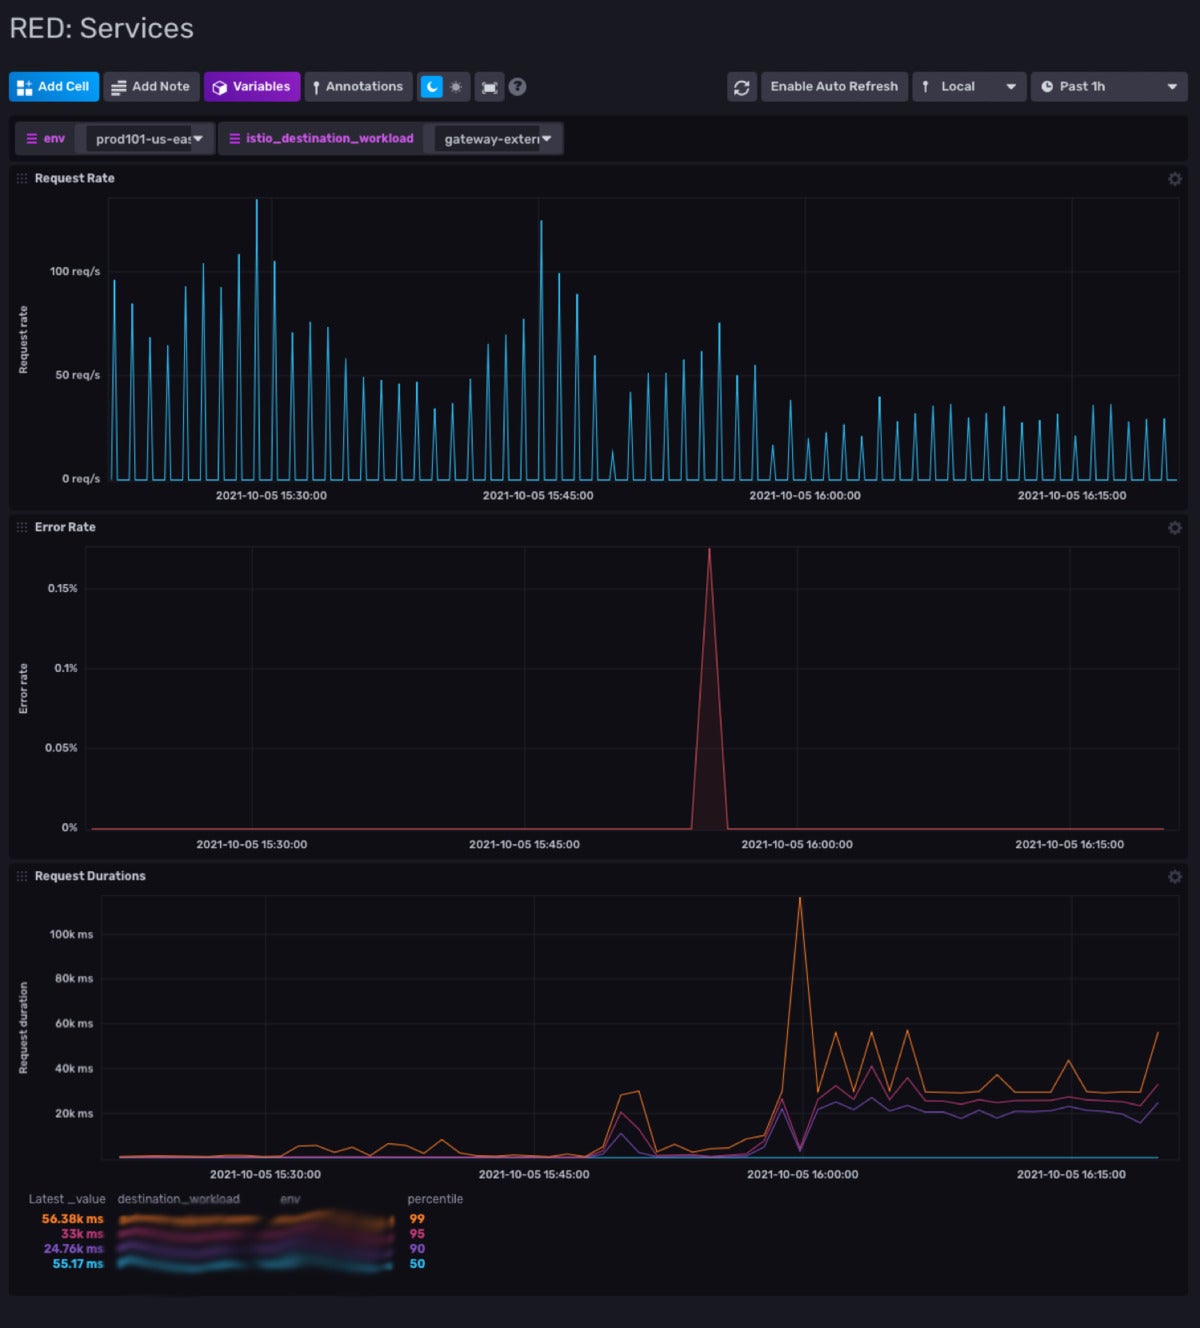
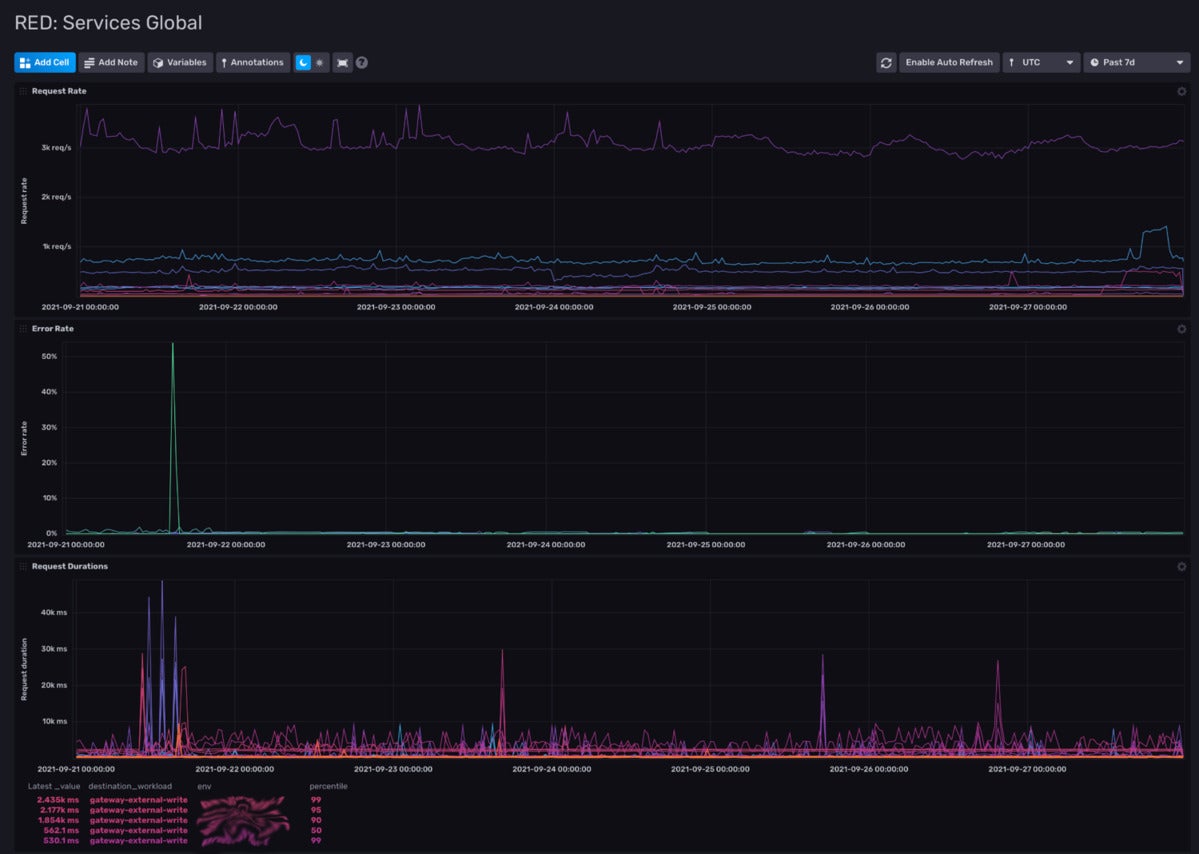
RED stands for rate, errors, and duration. These represent the three key metrics you want to monitor for each service in your architecture:
- Rate – The number of requests the service is handling per second.
- Error – The number of failed requests per second.
- Duration – The amount of time each request takes.
Using these three metrics, you can get a solid understanding of how your services are performing. The number of requests gives you a baseline for how much traffic is going to your service. The portion of those requests that are errors lets you know if a service is functioning within your SLO. Finally, the duration of time it takes for each request to be handled by your service gives you insight into the overall user experience of your application.
Benefits of the RED method
The first benefit of the RED method is helping to reduce the cognitive load required for engineers to determine why a service is having issues. RED abstracts away the internal details of each service into something that can be understood across the entire architecture. This not only means problems can be solved faster, but also that it is easier to scale an operations team because members can now be on-call for services they didn’t write themselves.
The RED abstraction makes it easy to understand what is going wrong and to determine how to fix it. Even if the service they are trying to fix is effectively a black box that they don’t understand internally, the engineer can look at telemetry data and determine the best action to improve the user experience. Because the same metrics are used for every service the amount of training time or service-specific knowledge is reduced as well.
Another benefit of the RED method is that it more closely aligns with users and the company’s overall objectives. Users don’t care about your infrastructure. They don’t care about your CPU utilization, your memory usage, or any other hardware metrics. They care if they start seeing error messages when they use your app. They care if pages on your website take a long time to load. The RED method makes it very clear when a service isn’t living up to your SLO and your users are having a poor experience.
A final benefit of the RED method is that automating tasks and alerts across your services becomes easier. Automating repetitive tasks is simpler and safer because all services are treated the same. You can also standardize things like dashboard layouts across services because the same three metrics are being used.
 InfluxData
 InfluxData
Limitations of the RED method
All of those benefits don’t mean the RED method is perfect. The RED method is primarily designed for request-driven applications, so for use cases that involve batch processing or streaming, it may not provide the insight you need.
A second downside is that the “external” view of RED means that you could have a hard time knowing how close a service is to failing. A slight increase in traffic may cause your response duration to increase and you may not have internal application metrics to determine why. Using the RED method means your metrics can be interpreted differently depending on multiple factors, so it does require deliberate implementation.
The good news is that the RED method was never intended as a way to cover all aspects of monitoring. Tom Wilkie recommends that the RED monitoring methodology be used in combination with other monitoring methods like USE to give teams full monitoring coverage of their application.
Tim Yocum is director of operations at InfluxData, where he is responsible for site reliability engineering and operations for InfluxData’s multi-cloud infrastructure. He has held leadership roles at startups and enterprises over the past 20 years, emphasizing the human factor in SRE team excellence.
—
New Tech Forum provides a venue to explore and discuss emerging enterprise technology in unprecedented depth and breadth. The selection is subjective, based on our pick of the technologies we believe to be important and of greatest interest to InfoWorld readers. InfoWorld does not accept marketing collateral for publication and reserves the right to edit all contributed content. Send all inquiries to [email protected].
Copyright © 2021 IDG Communications, Inc.


